Give Me a Clear Picture: Using Images in Documents
You don’t have to be a graphic artist to understand the value of graphics and visuals in a document. Images have several purposes such as– help define terms, increase reader’s comprehension, communicate ideas, emphasize a point, provide an easy comparison, help with reader’s retention. Each type of graphic has a distinct purpose and advantage; use these when writing your documents. We are living a visual society and images help to clarify topics. Your focus is helping the reader to comprehend what you are writing. Images are just one more tool to help communicate.
Here are some basic rules to keep in mind when using graphics and images:
- Make sure the image or graphic is directly relevant to your work; research to find the best image.
- Size the image appropriately. Make sure your image has appropriate spacing top and bottom, as well as, left and right.
- Have a consistent format for your images (left justified, centered, etc.)
- Label your images with a specific title ) and number them (for example, Figure 1. Image of an aircraft winglet).
- Place your image directly after the referenced section in the document.
- Cite your sources
- Consider using a List of Illustrations section if you have a larger document and many images.
Images are now becoming essential in strong written communication. Here are some examples:
 Timelines or calendars for describing tasks over a specific period of time |
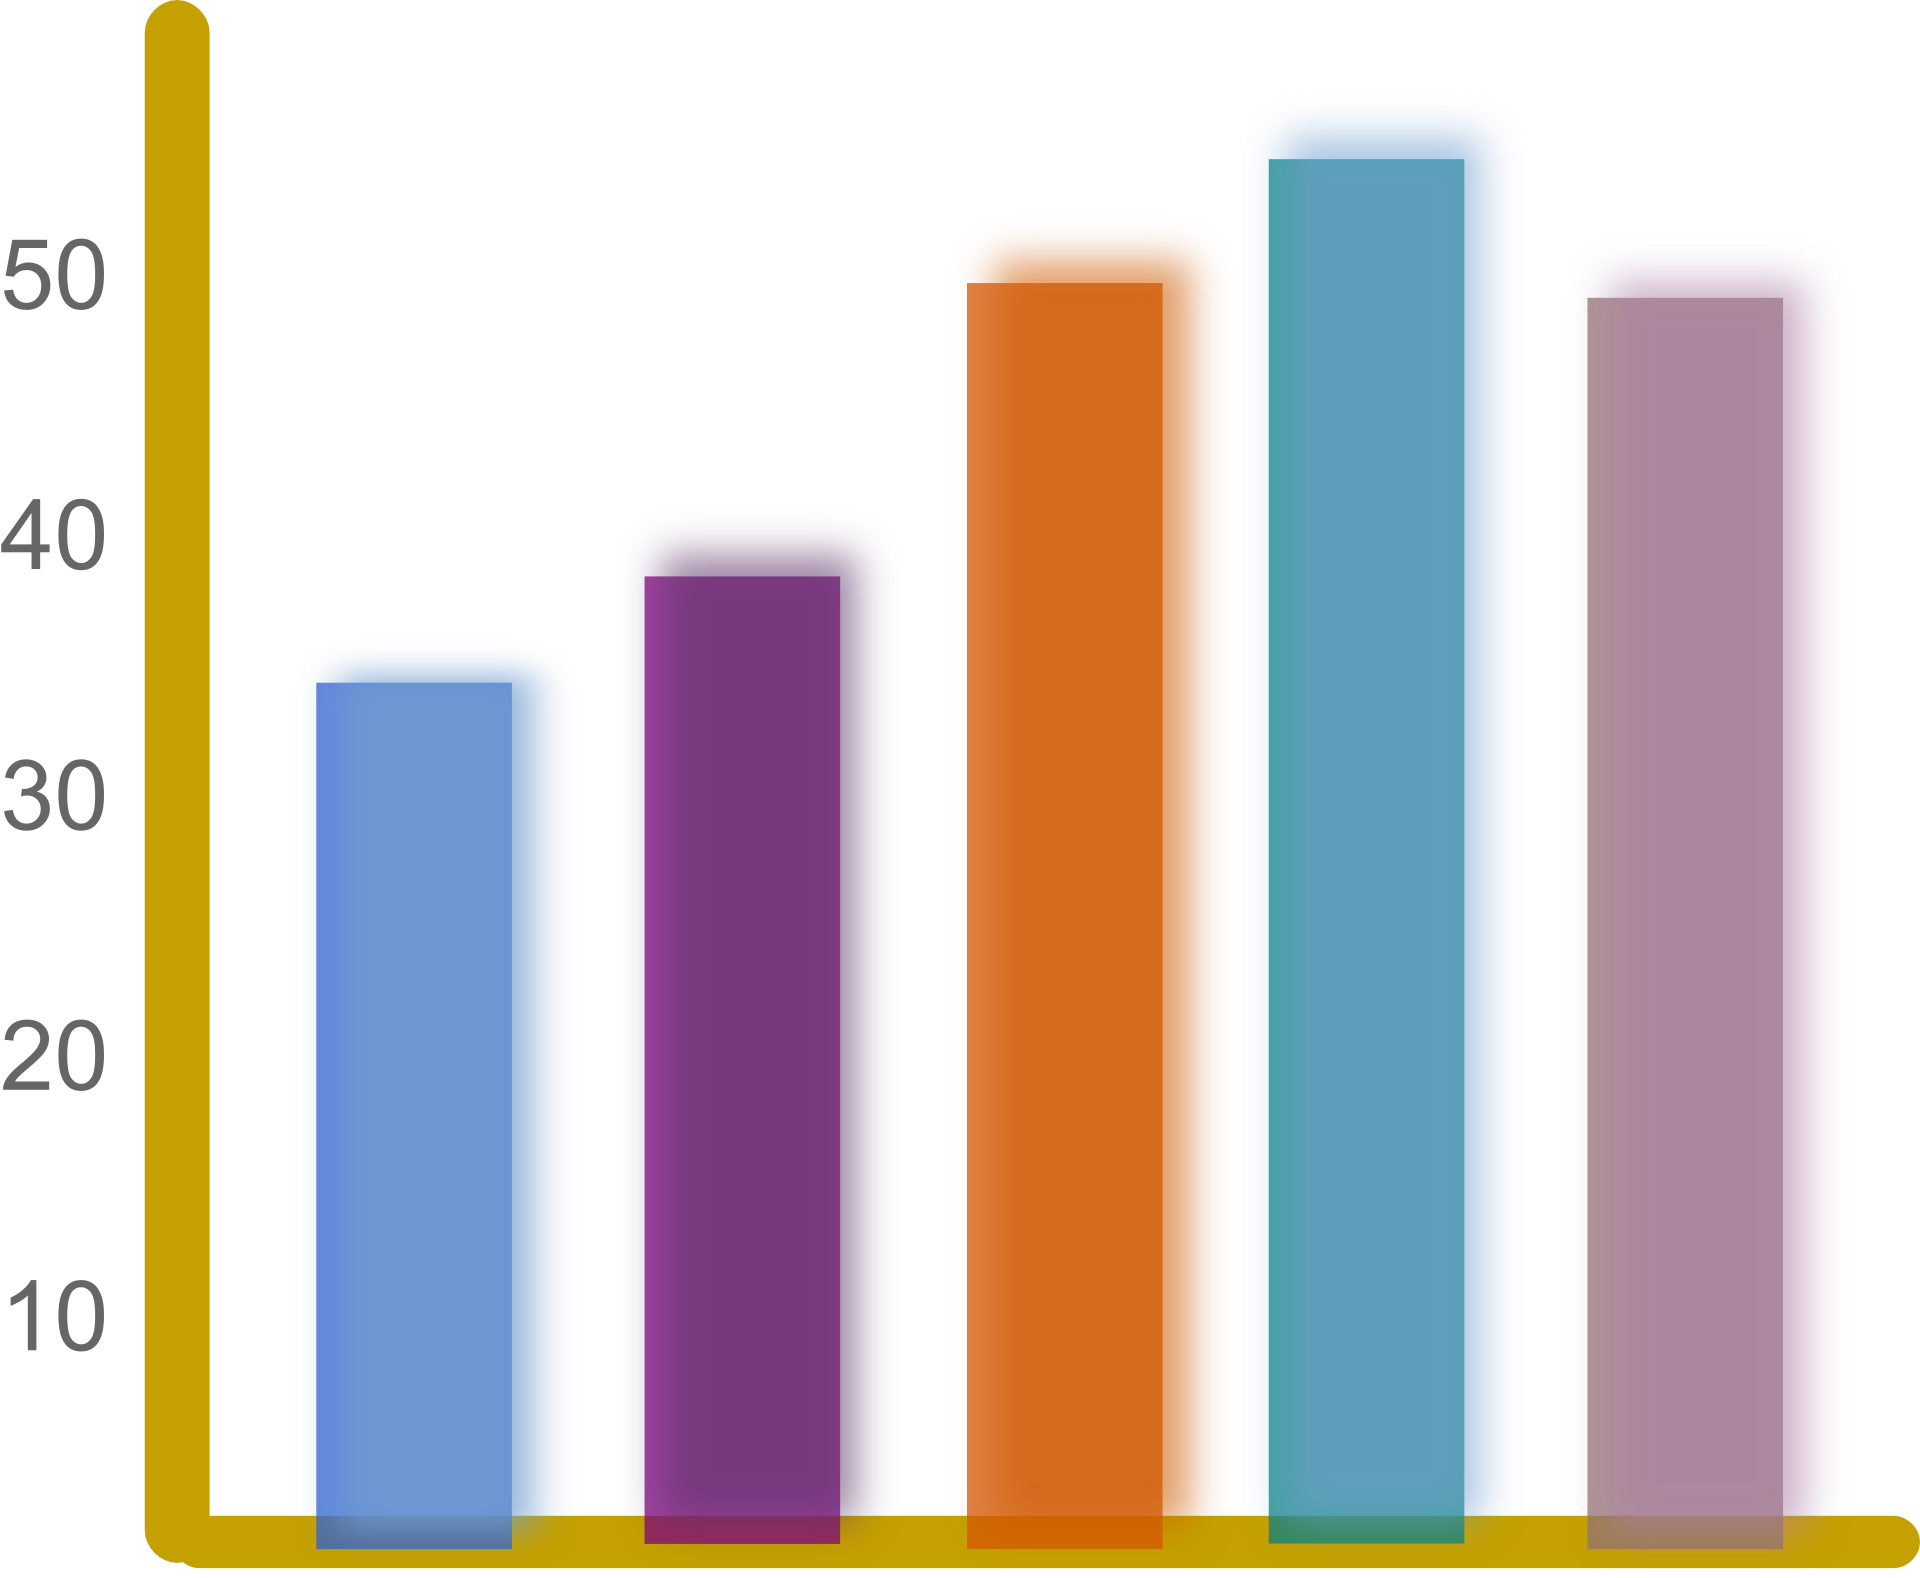
Bar charts to show comparisons. |

Pie charts show a relationship to the whole. |
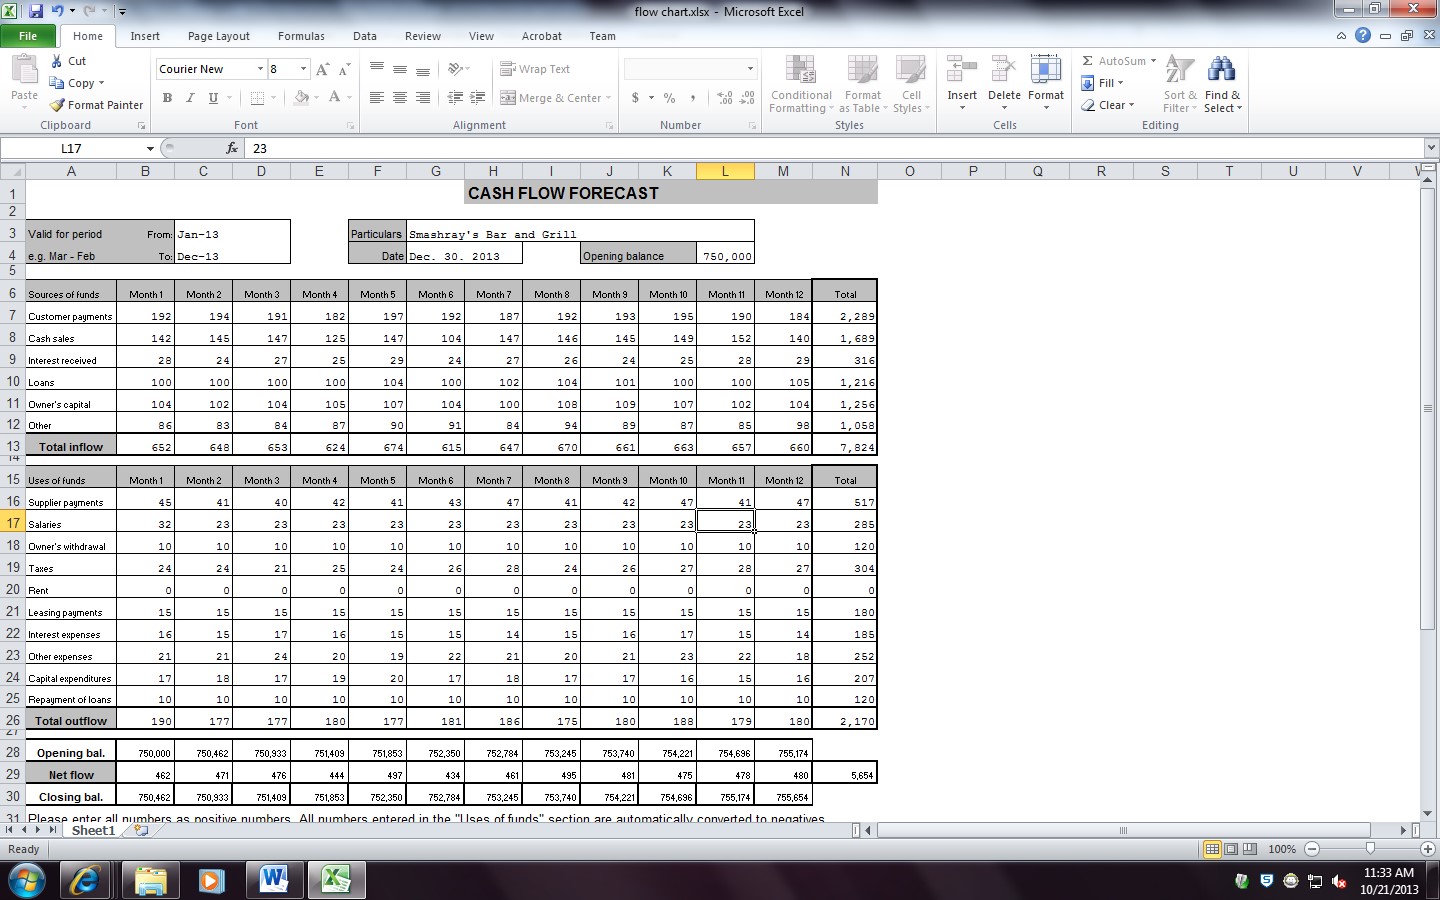
Tables show raw data prior to the graph. |
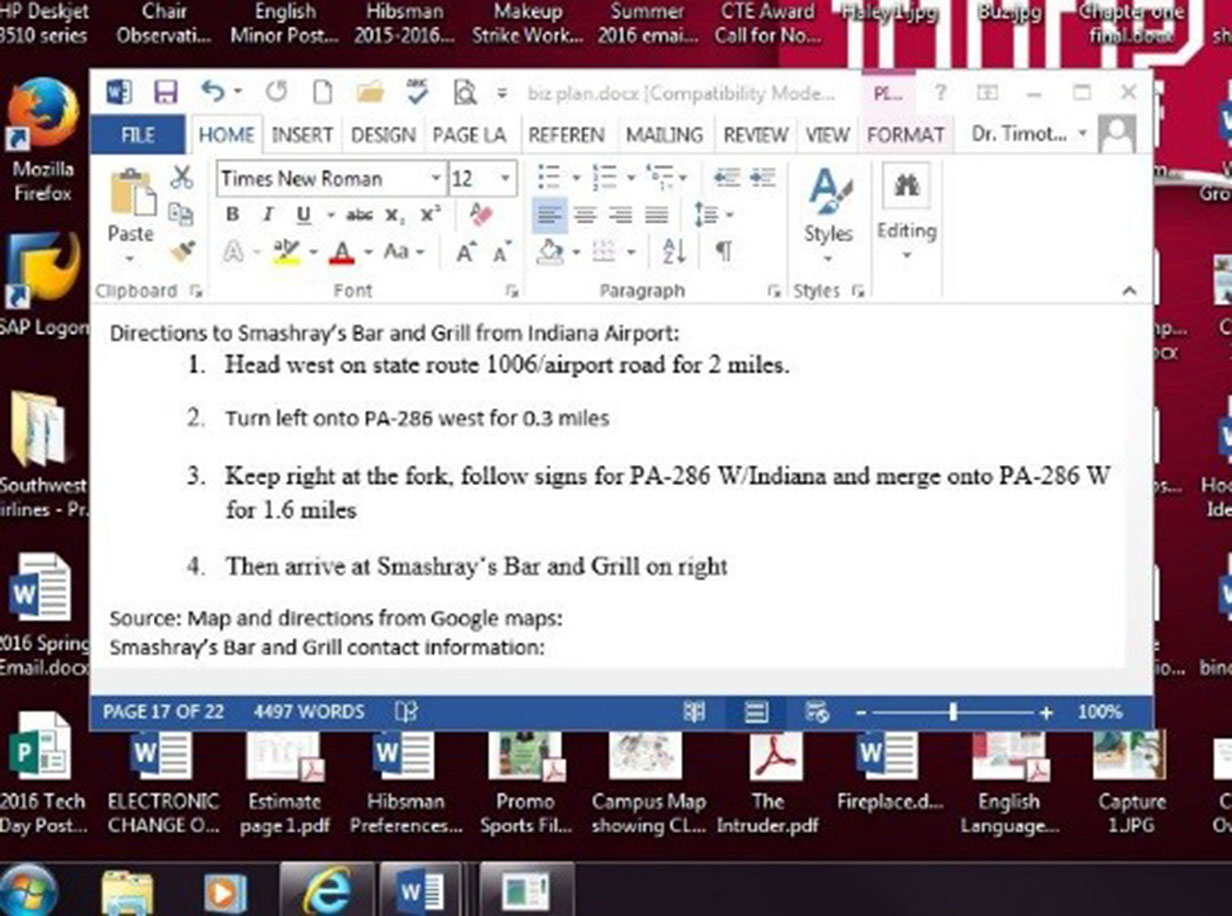
Screen captures, show exactly what is happening from the author’s perspective. |

Flow charts show pictorially how procedures, events or other factors are related to each other. |
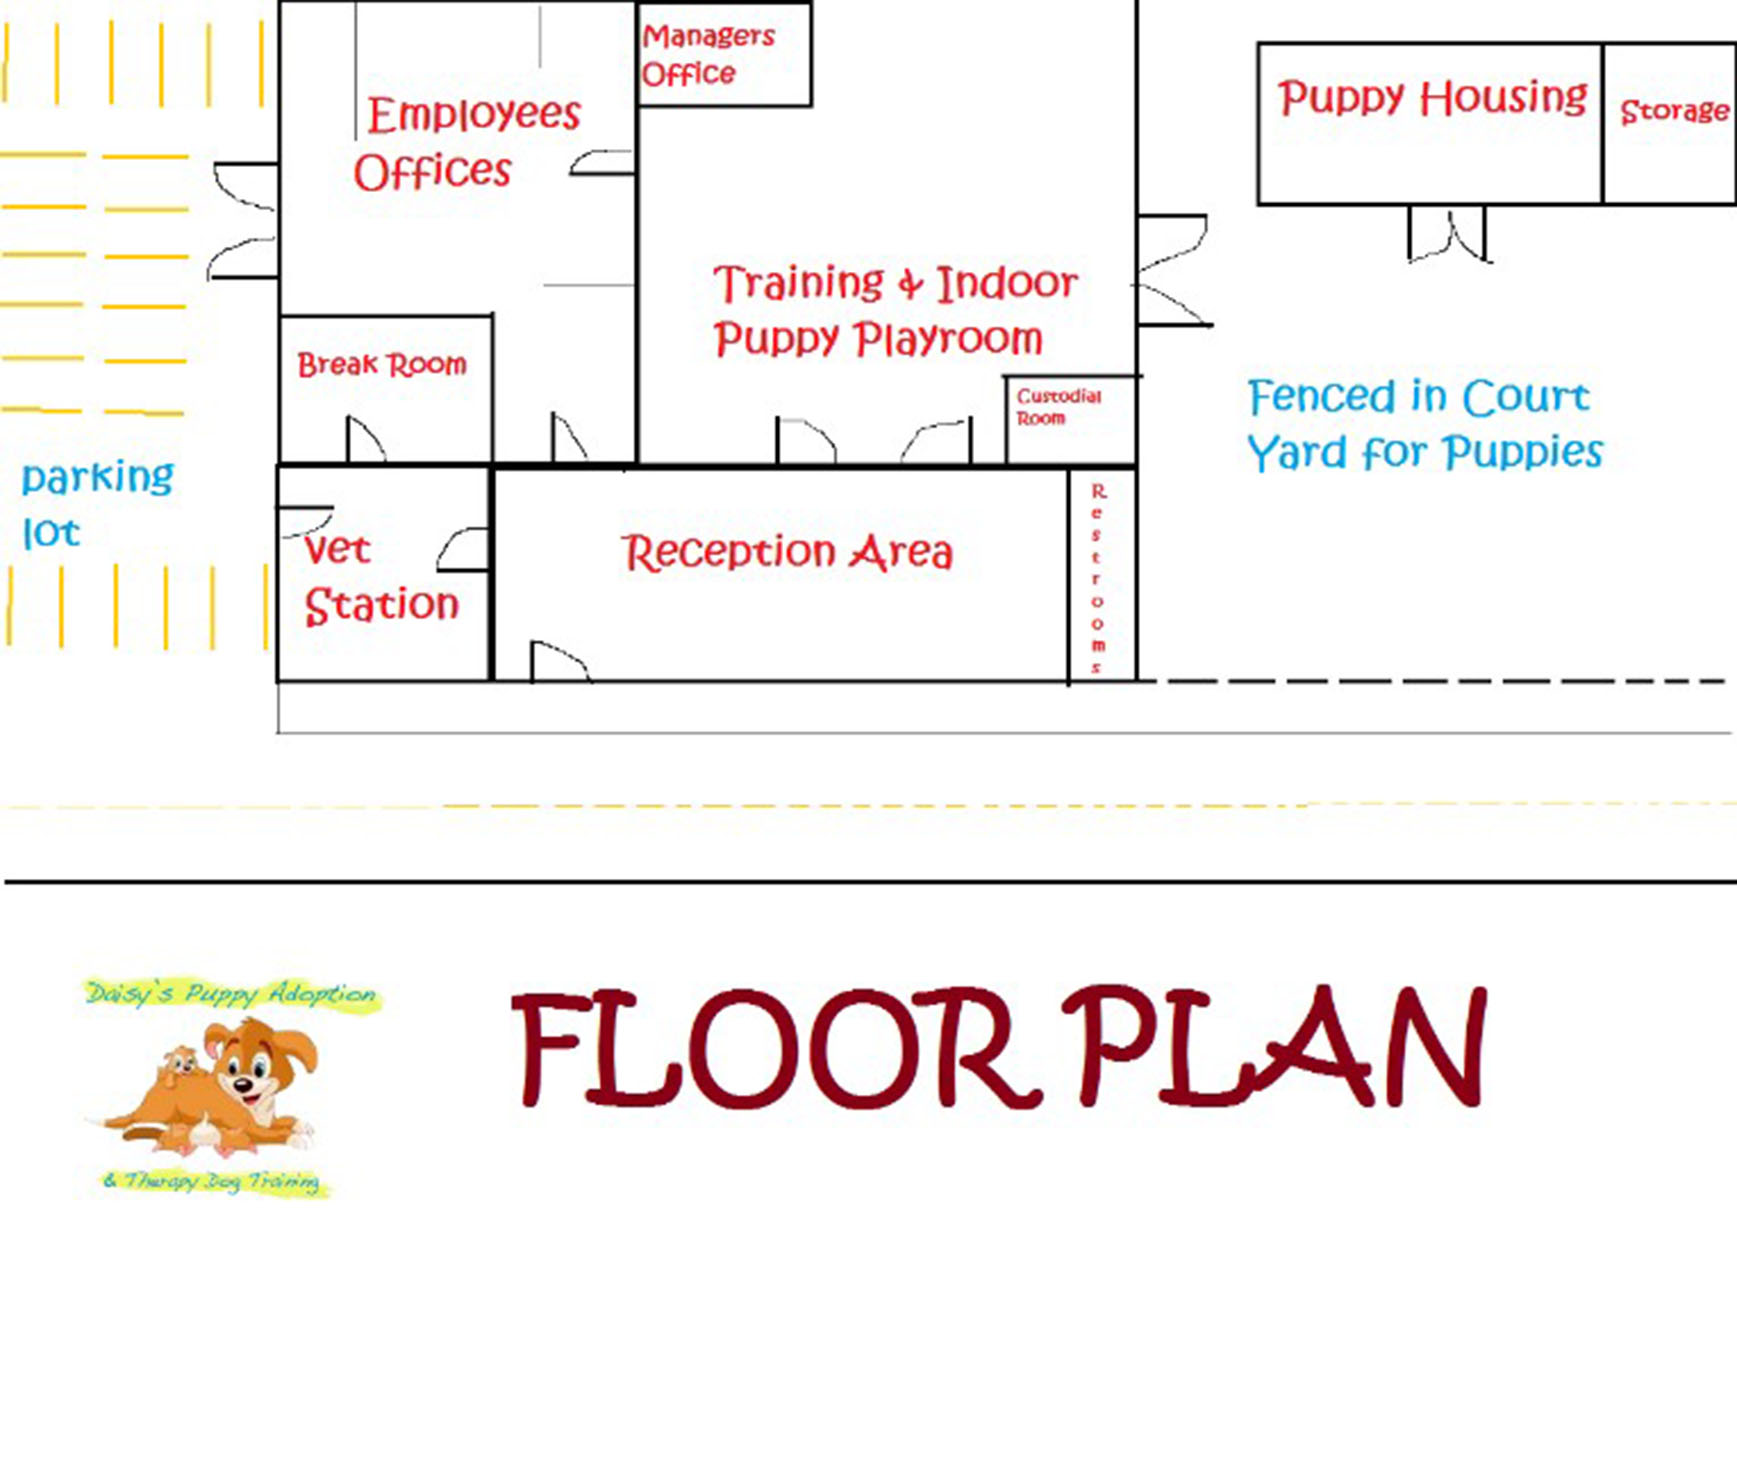
Floor plans show relationships between rooms and physical features in a designated space |
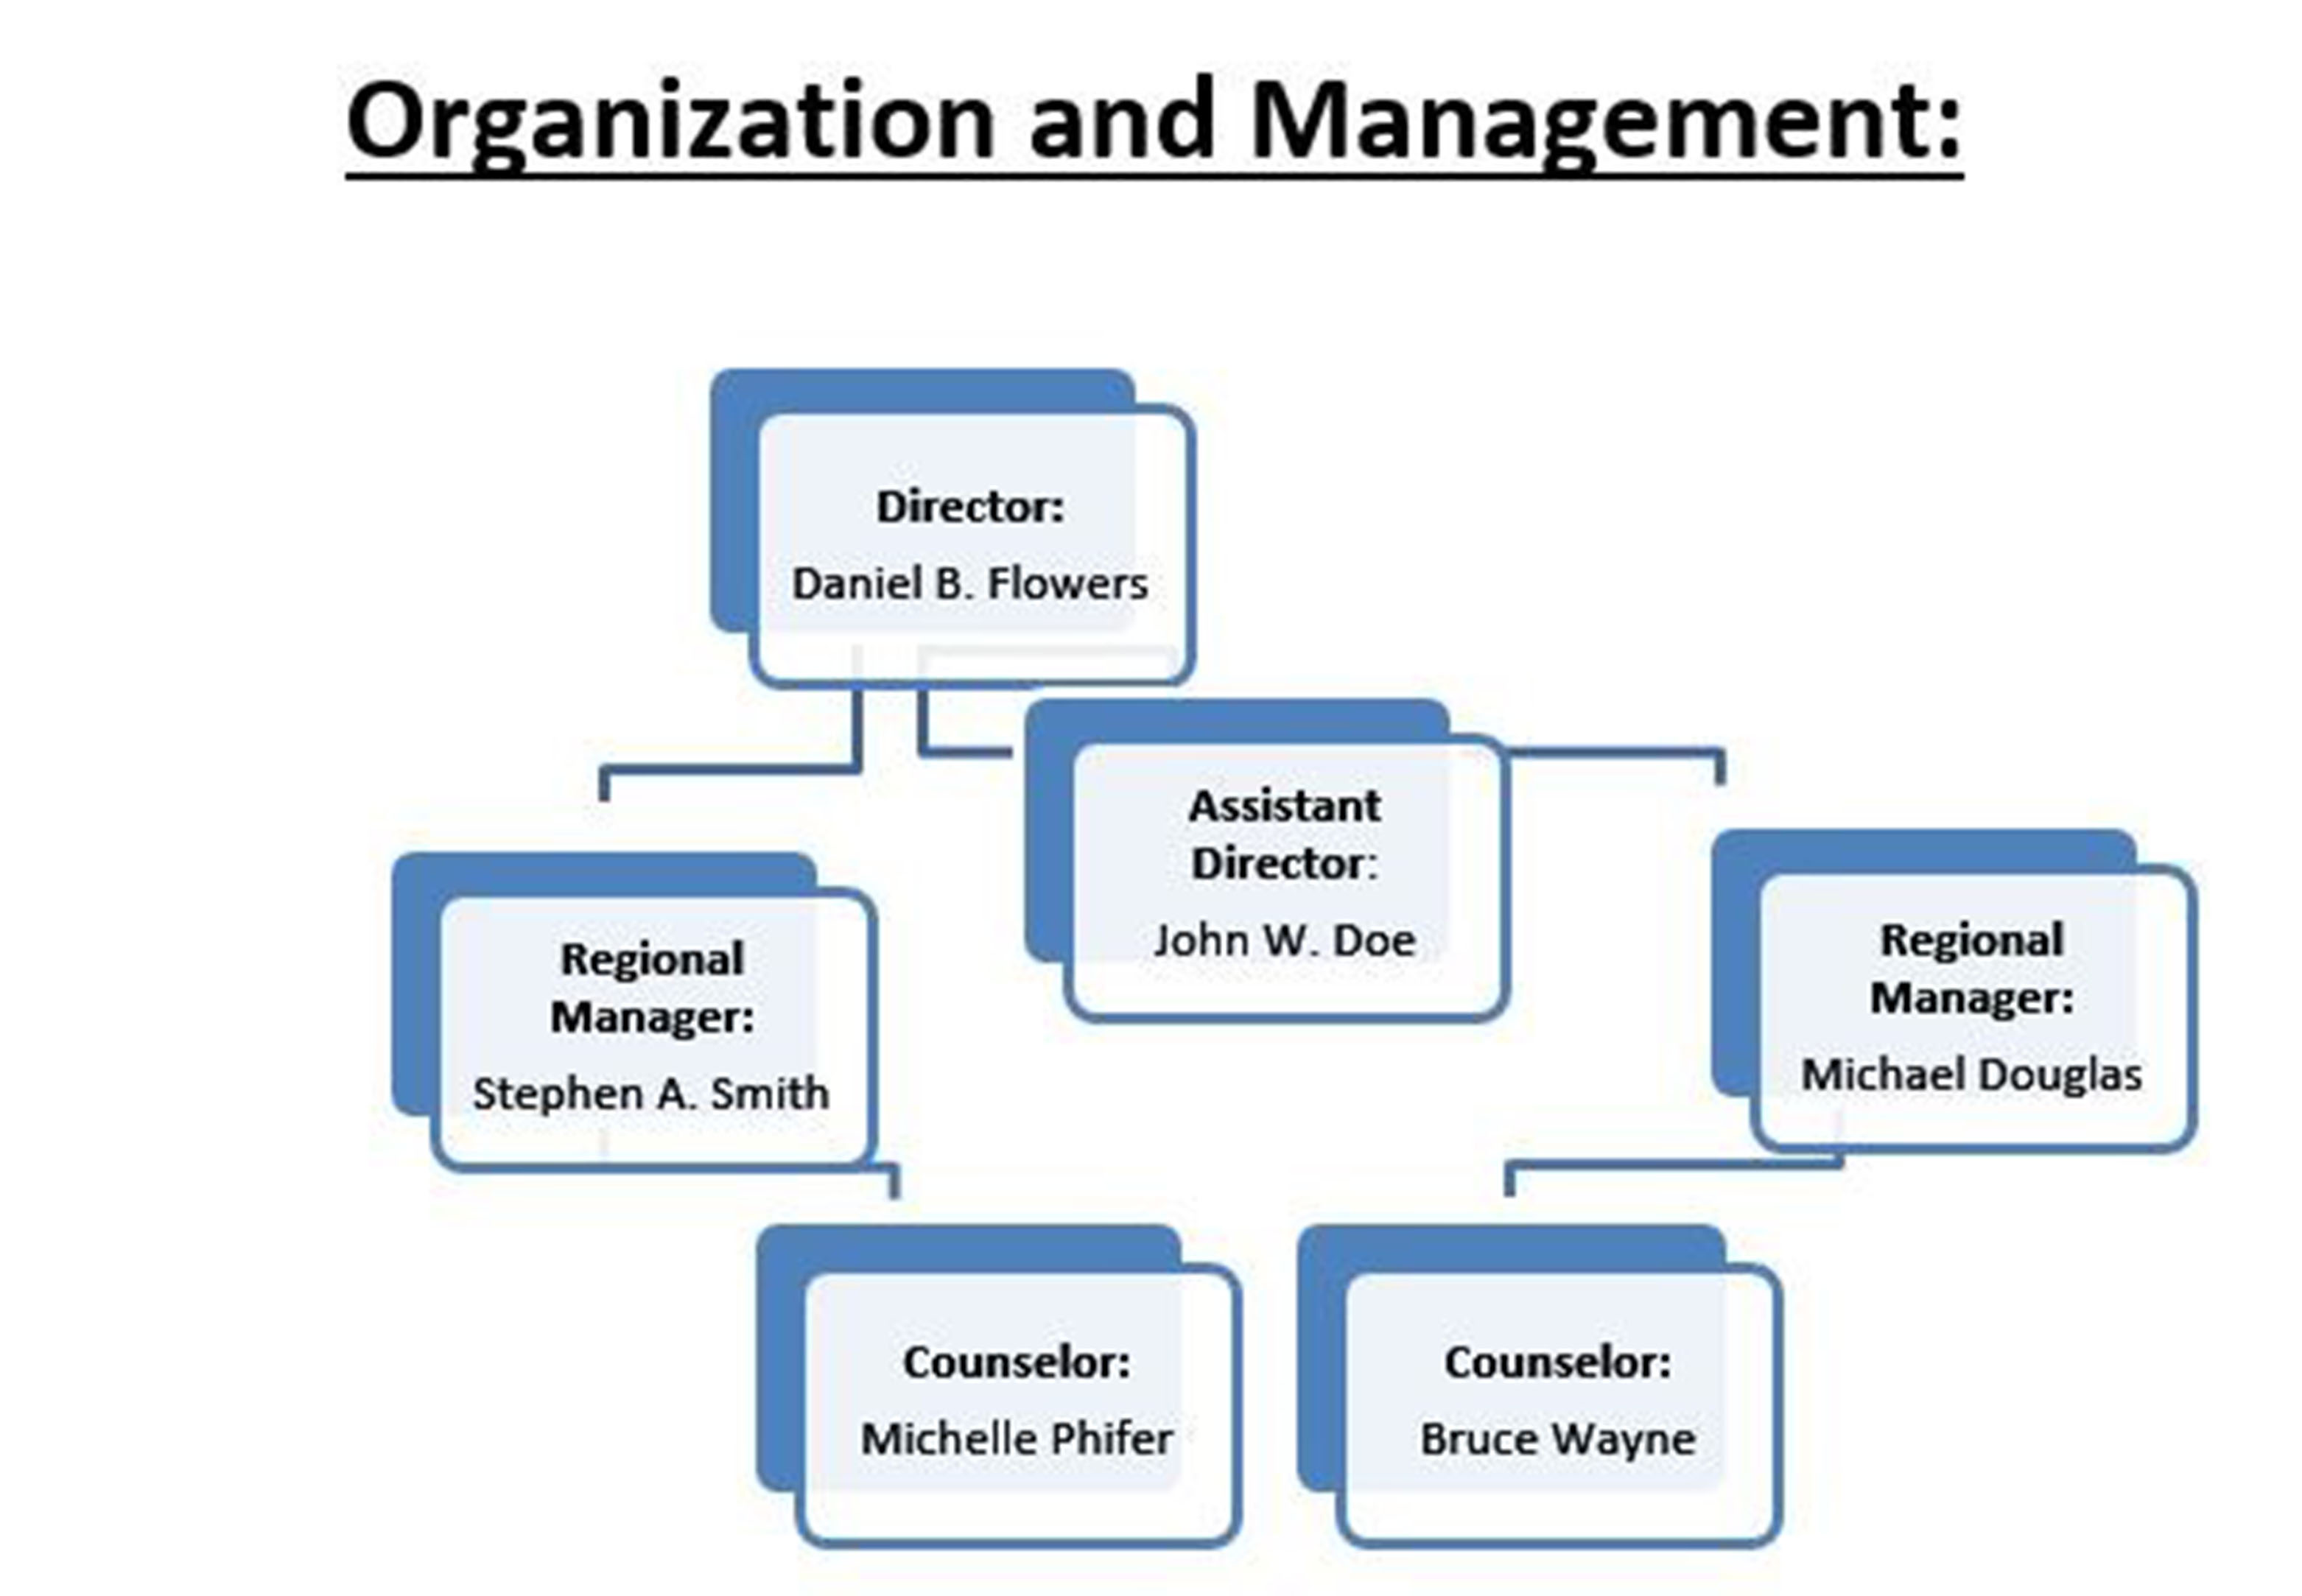
Organizational charts show the relationship of positions in the company. |
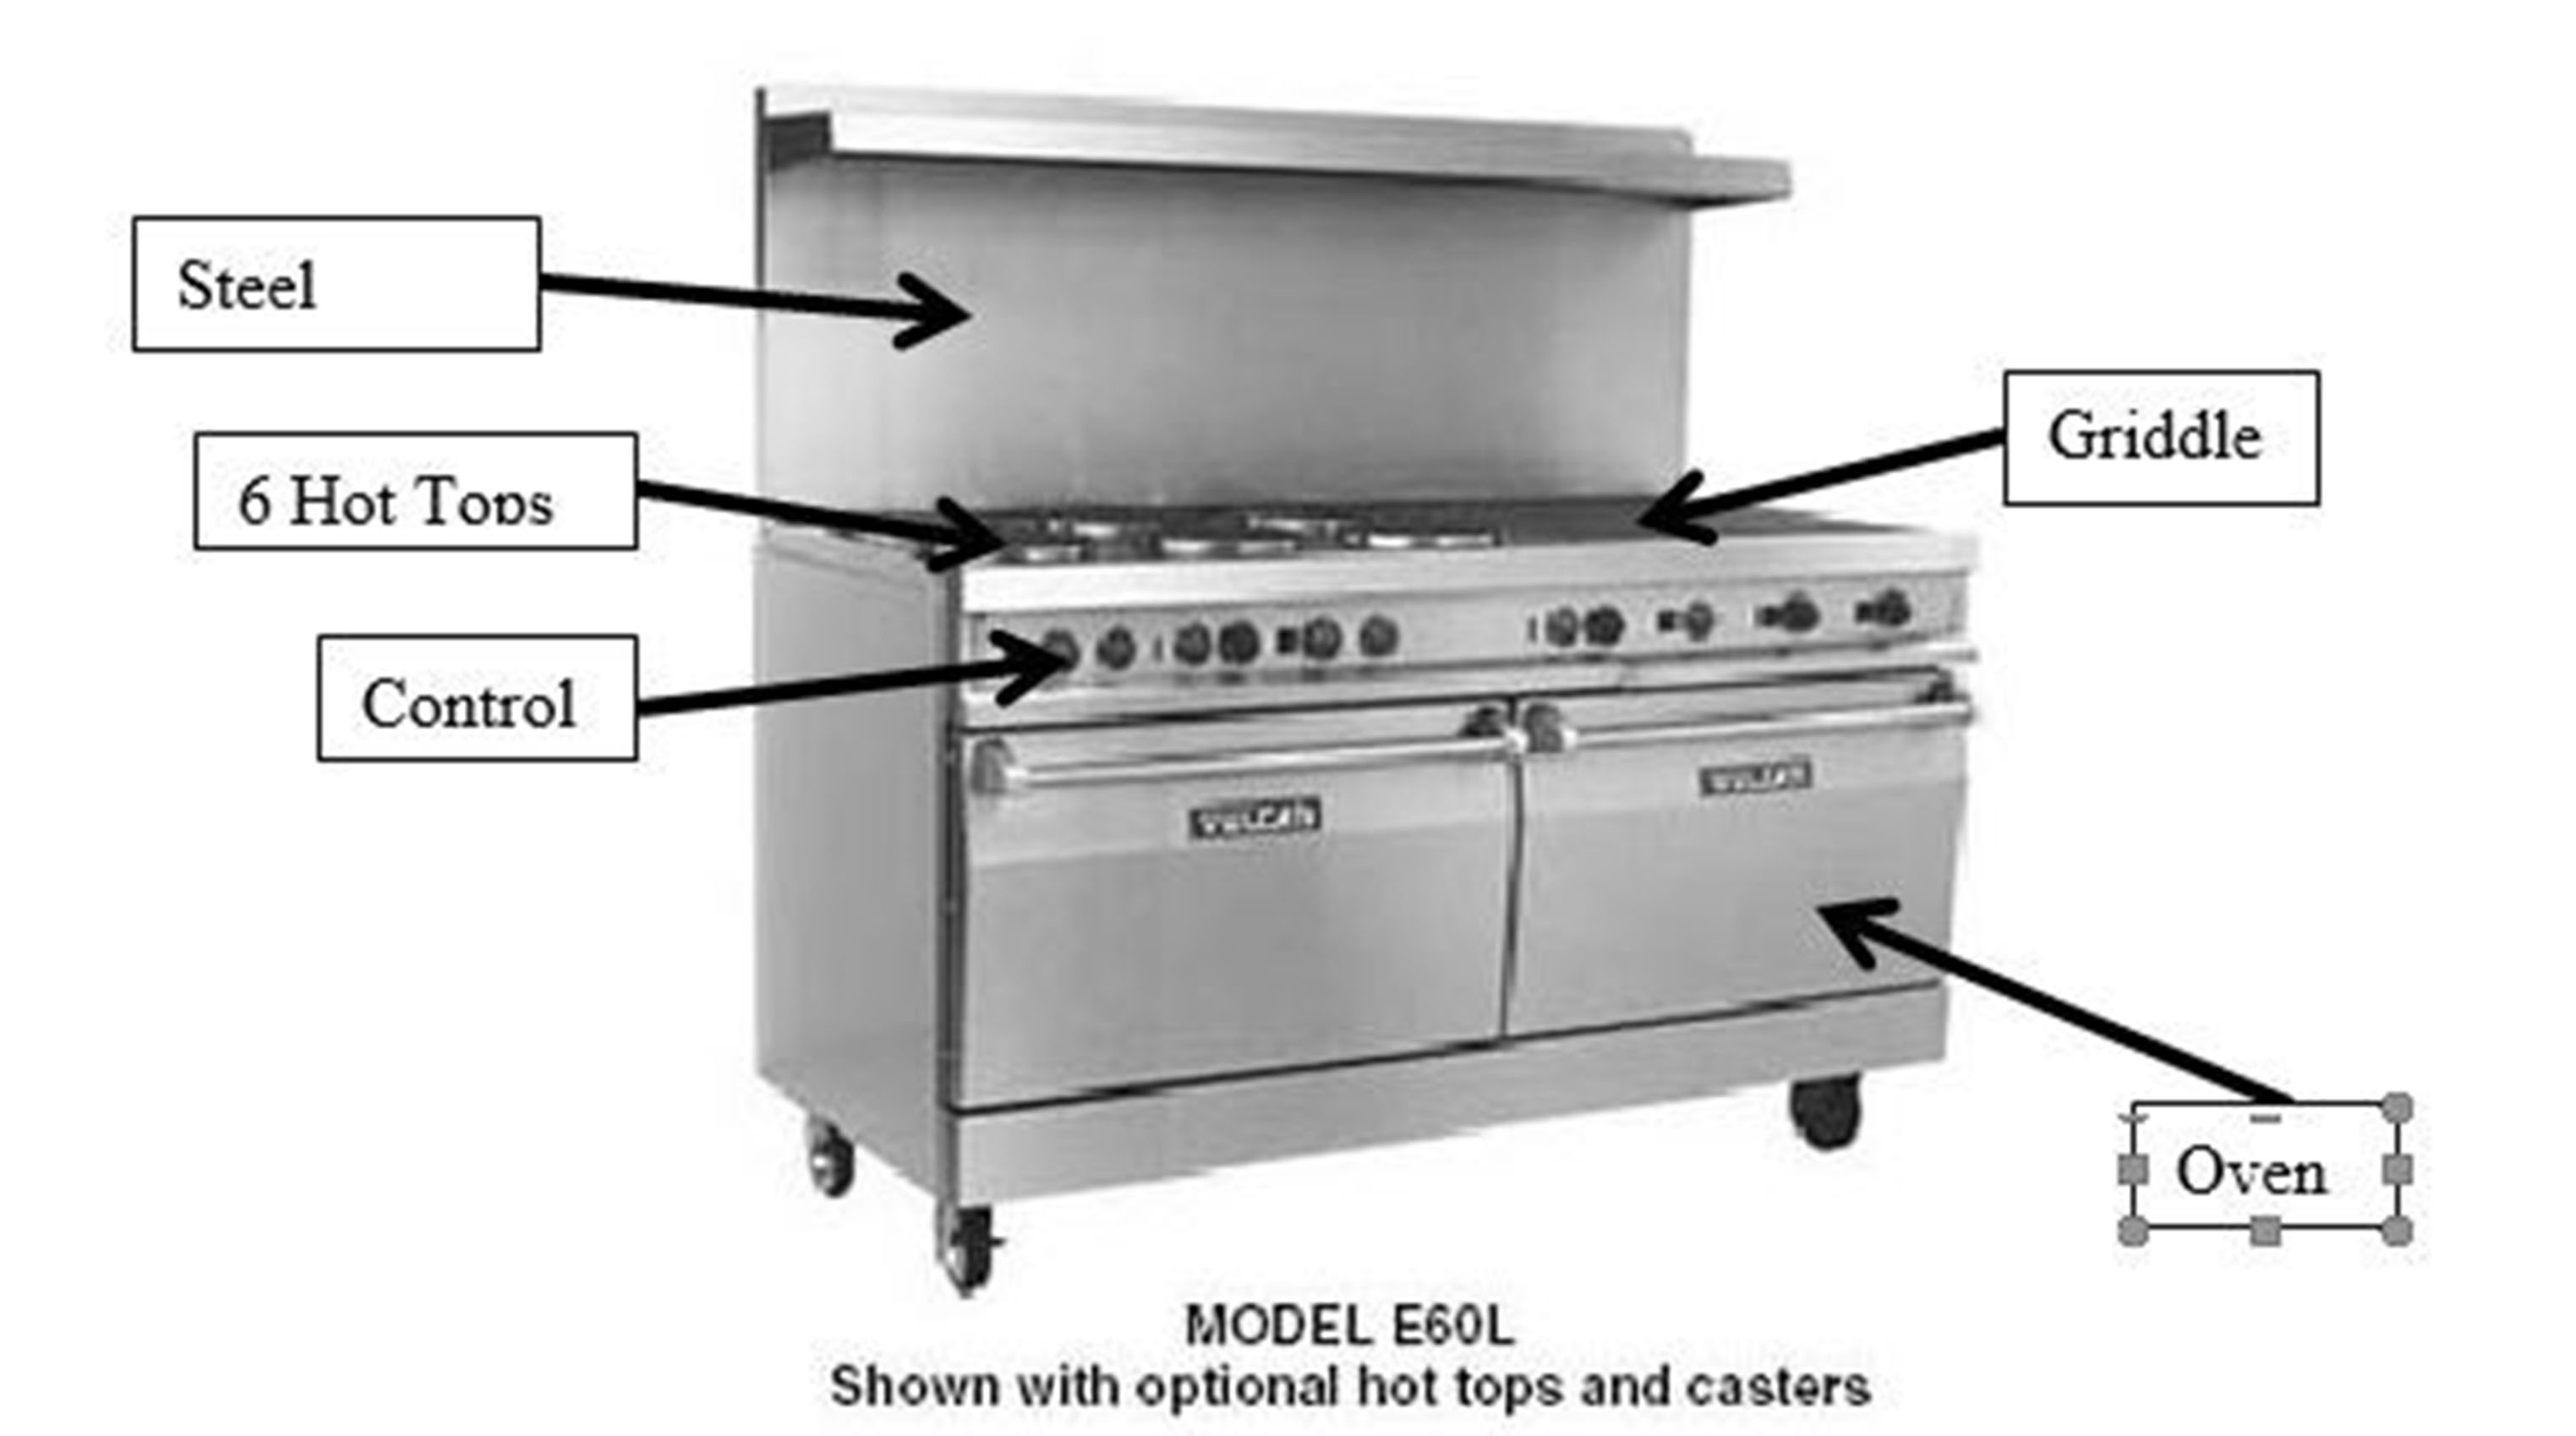
Mechanism images show a device, instruments, or product. (General, exploded, cutaway view) |